From the as-is network to market profitability
Each scenario answered a concrete footprint or service decision.
The work began by reproducing the current network. From that trusted baseline, the team generated candidate locations, optimized which distribution and production assets should remain active and traced the economic consequence down to markets and customers.
5 + 2plants and grinding units
6distribution centers
200+scenarios evaluated
- 01Model and validate the as-is networkReproduce demand, capacity, production, logistics and costs before proposing change.
- 02Generate candidate locationsUse barycenter analysis to identify promising areas for new distribution alternatives.
- 03Optimize the distribution footprintUse CP-SAT Brownfield scenarios to activate or deactivate distribution centers under a global economic objective.
- 04Optimize manufacturing vocationSwitch production lines on or off and reallocate products when another factory creates a better total result.
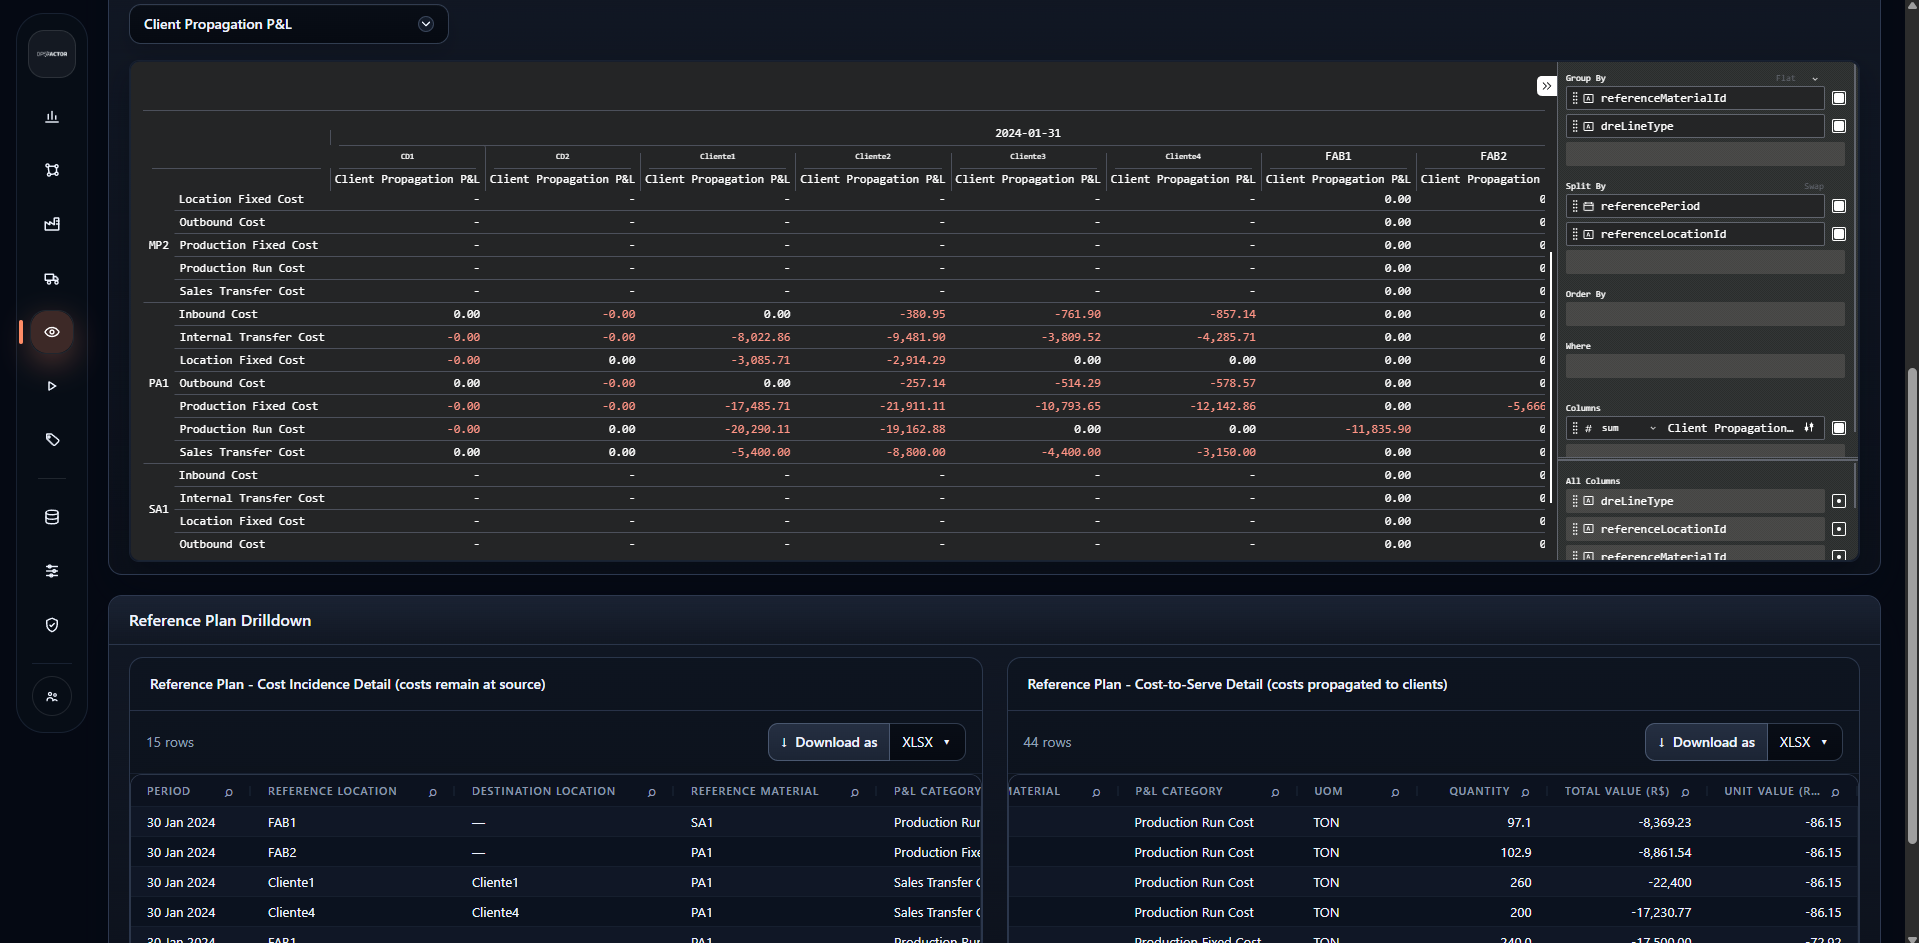
- 05Read Cost-to-Serve by marketCompare profitability by municipality, customer and microregion to support expansion or service-share decisions.
The same model can be rerun as assumptions change, keeping strategic and recurring network decisions inside the planning team instead of turning each question into a new consulting study.
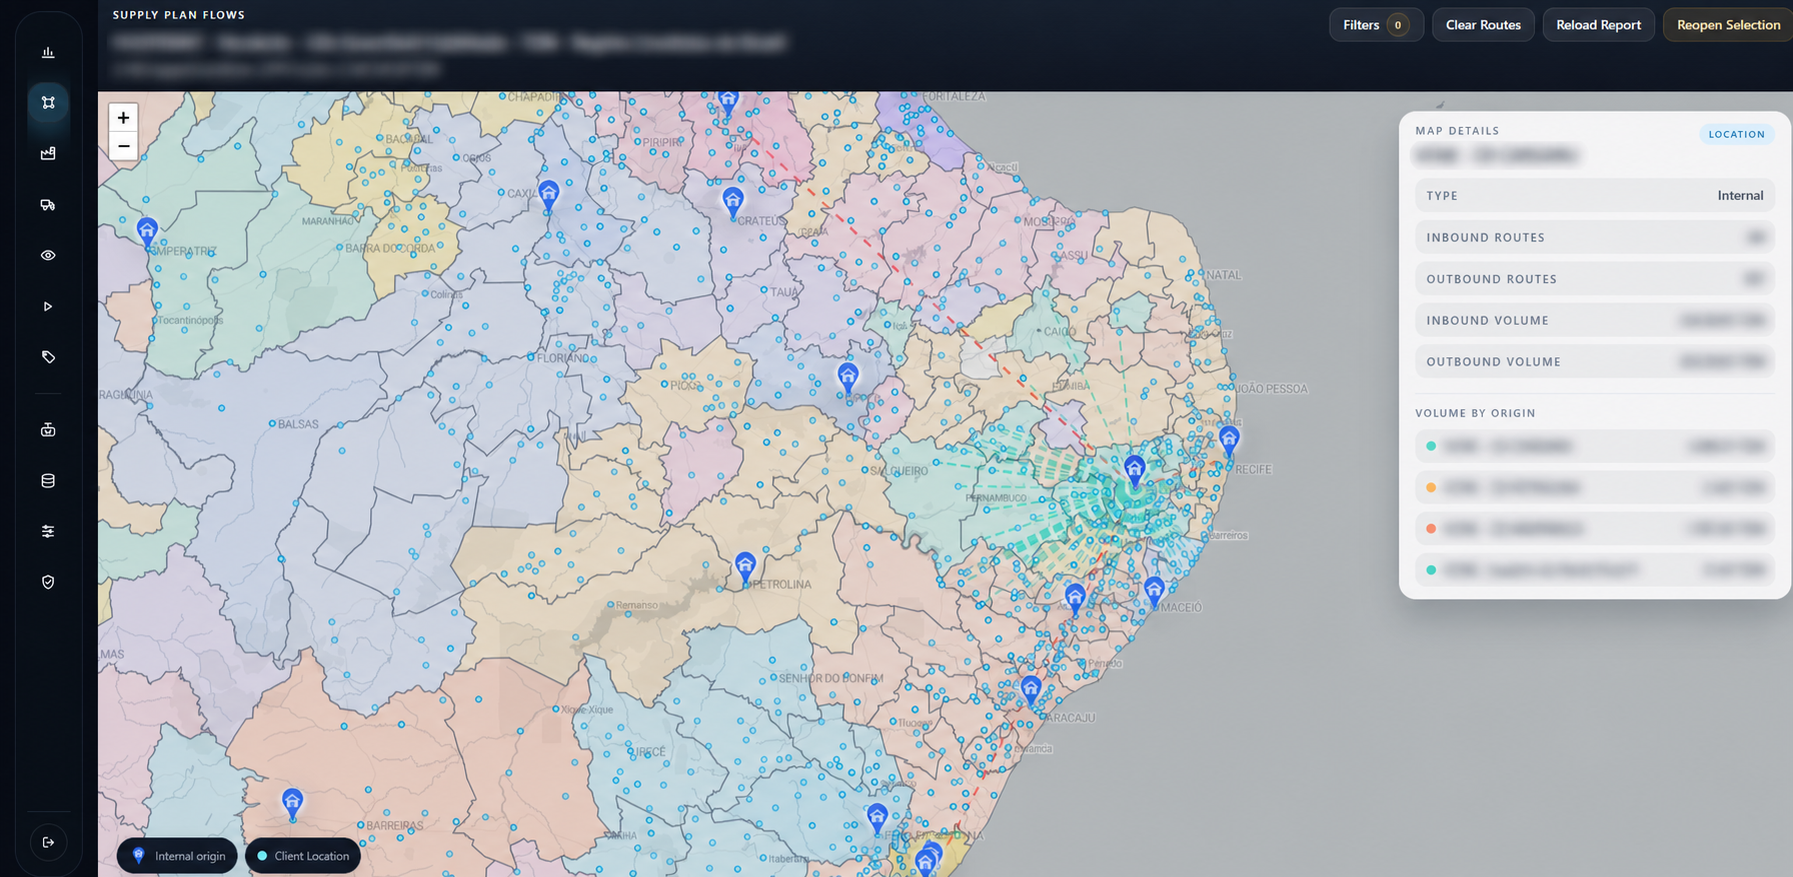
Figures describe the scope and potential scenario impact reported in the publication. They are not presented as realized or audited gains.Supply Plan Flows
Cost-to-Serve & P&L